Why Custom?
rCharts provides almost every chart type imaginable through multiple js libraries. The speed at which it has added libraries shows that the authors are well aware of the quick pace of innovation in the visualization community especially around d3.js. It is foolish to think though that every chart in every combination with every interaction will be available, so fortunately rCharts is designed to also easily accommodate custom charts.
There are already some very impressive conversions of complicated NY Times Interactive pieces, but I thought it would be helpful to show how we might convert a more basic chart type with less moving parts. Since I love horizon plots (summarized in Horizon Plots with plot.xts and explained in More on Horizon Charts), the horizon plot d3 plugin from Jason Davies will be a lovely target.
This tutorial will go in depth to explain some of the inner workings of rCharts as we work through an implementation of d3 horizon plots. We will see how rCharts
- uses mustache templates through the R package
whiskerto bind html/js withR, - employs YAML through the R package
yamlfor configuration, and - passes data and parameters with
RJSONIO.
Disclaimer and Attribution
Much of this work is based on the horizon plot plugin by Jason Davies and the example by Mike Bostock.
rCharts Innards
A Naked rChart
What does a naked rChart look like?
#if you do not have rCharts or if you have an outdated version
#require(devtools)
#install_github('rCharts', 'ramnathv')
require(rCharts)
rChart <- rCharts$new()
str(rChart)
Reference class 'rCharts' [package "rCharts"] with 8 fields
 $ params   :List of 3
  ..$ dom   : chr "chart249c44ec1879"
  ..$ width : num 800
  ..$ height: num 400
 $ lib      : chr "rcharts"
 $ LIB      :List of 2
  ..$ name: chr "rcharts"
  ..$ url : chr ""
 $ srccode  : NULL
 $ tObj     : list()
 $ container: chr "div"
 $ html_id  : chr ""
 $ templates:List of 3
  ..$ page    : chr "rChart.html"
  ..$ chartDiv: NULL
  ..$ script  : chr "/layouts/chart.html"
 and 24 methods, of which 12 are possibly relevant:
   addParams, getPayload, html, initialize, print, publish, render, save,
   set, setLib, setTemplate, show#envRefClass
Only if it matters to you, a rChart is a R5 object or reference class. If it doesn't matter to you, just forget what I just said. As the str output tells us, this rChart has 8 fields and 24 methods (functions), of which 12 "are possibly relevant". I am guessing some like width and height do not need much explanation, but the others might not be immediately understood. Since I learn by breaking, what happens if we call rChart?
rChart
Templates with Mustaches
Darn it didn't work, but we did get a clue /layouts/chart.html. This falls into the templates field in the str output above and looks like a file and directory. I guess it would be wise to inspect this templates field. In it, we find page, chartDiv, and script. page and script look like html files, so let's find out where these are and what's inside. page is defined as rChart.html, which is inside your R rCharts package. You can see for yourself by typing the following in R:
readLines(system.file('rChart.html', package = 'rCharts'))
or you can also find the rChart.html here in source.
<!doctype HTML>
<meta charset = 'utf-8'>
<html>
  <head>
    {{# assets.css }}
    <link rel='stylesheet' href='{{{ . }}}'>
    {{/ assets.css }}

    {{# assets.jshead }}
    <script src='{{{ . }}}' type='text/javascript'></script>
    {{/ assets.jshead }}

    <style>
    .rChart {
      display: block;
      margin-left: auto;
      margin-right: auto;
      width: {{params.width}}px;
      height: {{params.height}}px;
    }
    </style>

  </head>
  <body>
    {{# chartId }}
    <{{container}} id='{{chartId}}' class='rChart {{ lib }}'></{{container}}>
    {{/ chartId }}

    {{{ script }}}

  </body>
</html>
All the {{{ }}} provide some of the magic behind rCharts. These multiple {{{ }}} are mustaches and get filled through the R package whisker as described in the whisker Readme.md.
Whisker is a {{Mustache}} implementation in R confirming to the Mustache specification. Mustache is a logicless templating language, meaning that no programming source code can be used in your templates. This may seem very limited, but Mustache is nonetheless powerful and has the advantage of being able to be used unaltered in many programming languages. It makes it very easy to write a web application in R using Mustache templates which could also be re-used for client-side rendering with "Mustache.js". Mustache (and therefore whisker) takes a simple, but different, approach to templating compared to most templating engines. Most templating libraries, such as Sweave, knitr and brew, allow the user to mix programming code and text throughout the template. This is powerful, but ties your template directly to a programming language and makes it difficult to seperate programming code from templating code. Whisker, on the other hand, takes a Mustache template and uses the variables of the current environment (or the supplied list) to fill in the variables.
So all these multiple mustaches {{{ }}} get shaven and replaced with R variables or function output. For instance, the mustached {{ chartId }} will get populated by the R variable chartId. This gets assigned in the render method chartId = params$dom. If we look back at our str output above we see
$ params   :List of 3
   ..$ dom   : chr "chart249c44ec1879"
so once we fix our error (nope, still haven't even come close to fixing), we should see this is our html output. Now let's see why our mustache is full of YAML.
Mustache Full of YAML
If we are working with html/js, we have to expect some js and css file dependencies that we will need to load. rCharts looks for a YAML file config.yml to tell us the location for all these js and css files. This line
assets = get_assets(LIB, static = T, cdn = cdn)
calls this line
get_assets <- function(LIB, static = T, cdn = F){
  config = yaml.load_file(file.path(LIB$url, 'config.yml'))[[1]]
which parses the YAML for our js and css file locations. As an example, below is the config.yml for the rCharts implementation of NVD3.
nvd3:
  css: [css/nv.d3.css, css/rNVD3.css]
  jshead: [js/jquery-1.8.2.min.js, js/d3.v3.min.js, "js/nv.d3.min-new.js", js/fisheye.js]
  cdn:
    css: http://nvd3.org/src/nv.d3.css
    jshead:
      - "http://ajax.googleapis.com/ajax/libs/jquery/1.8.3/jquery.min.js"
      - "http://d3js.org/d3.v2.min.js"
      - "http://nvd3.org/nv.d3.js"
      - "http://nvd3.org/lib/fisheye.js"
rCharts is smart enough to handle the css and js for both a local rendering and a rendering which might be happier served from a CDN. whisker and mustache are smart enough to handle array type structures to list each file if there is more than one file.
You might wonder if we will ever fix our error and see a horizon plot. Let's do both at the same time in the next section.
Convert the Horizon
Finally, Fix Our Error and Start to See the Horizon
The reason for our error
## Warning: cannot open file '/layouts/chart.html': No such file or directory
is mustache tries to fill the {{{ script }}} portion of rChart.html with a file specified by which is
rChart$templates$script
[1] "/layouts/chart.html"
which might or might not exist. We can get away with not specifying the location of templates$page (rChart.html). It is designed to be fairly universal, so there is a default in the rCharts package, but the script template for each library or custom implementation will be different. In each of the library implementations, templates$script will be populated at initialization in these two lines of code.
lib <<- tolower(as.character(class(.self)))
LIB <<- get_lib(lib) # library name and url to library folder
Here is the chart.html script template for NVD3, which rCharts will assume is in libraries/nvd3/layouts/ directory, since the reference class for NVD3 is called Nvd3 setRefClass('Nvd3'....
Roll Your Own Template
For custom charts, we will need to write our own script (easy enough usually with a lot of copy/paste) and tell rCharts where to find it. We could put it anywhere. For this tutorial, I will be using the R package slidify which will prefer that my directory is in /libraries/widgets/. To be original I will name my widget d3_horizon and my script template d3_horizon.html, so the full directory will be /libraries/widgets/d3_horizon/layouts/d3_horizon.html. Here is how we would tell rCharts to find our custom template.
rChart$setLib('libraries/widgets/d3_horizon')
rChart$setTemplate(script = "libraries/widgets/d3_horizon/layouts/d3_horizon.html")
As I said, the script template usually will be a lot of copy/paste if you are trying to recreate something you have seen. For the horizon plot, let's copy/paste from this example by Mike Bostock.
Draw a Mustache on Your Copy/Paste
The basic process is find each of the variables or parameters we would like to define in R. All of the parameters for our horizon plot are nicely provided in the first couple lines of code in the horizon.js plugin.
    var bands = 1, // between 1 and 5, typically
        mode = "offset", // or mirror
        interpolate = "linear", // or basis, monotone, step-before, etc.
        x = d3_horizonX,
        y = d3_horizonY,
        w = 960,
        h = 40,
        duration = 0;
In R, we can set these with set like this
rChart$set(
  bands = 3,
  mode = "mirror",
  interpolate = "basis",
  width = 700,
  height = 300
)
and all of these will go into the rCharts$params list. Remember our powerful and sexy mustache. We can get these parameters with it. Just triple mustache {{{ params }}}.
Now let's find the relevant parts of the code from the example.
var chart = d3.horizon()
    .width(width)
    .height(height)
    .bands(1)
    .mode("mirror")
    .interpolate("basis");

var svg = d3.select("body").append("svg")
    .attr("width", width)
    .attr("height", height);

...

// Render the chart.
svg.data([data]).call(chart);
We will change them just slightly to the following.
var params = {{{ chartParams }}};

var svg = d3.select('#' + params.id).append("svg")
    .attr("width", params.width)
    .attr("height", params.height);

var chart = d3.horizon()
    .width(params.width)
    .height(params.height)
    .bands(params.band)
    .mode(params.mode)
    .interpolate(params.interpolate);

svg.data(params.data).call(chart)
If you are following along at home, copy and paste that into your script template chart.html. You can see mine here.
Supply the Data
Those paying real close attention will know params$data has not been defined. Let's supply some data in the form of rolling 12-month returns on the S&P 500.
require(quantmod)
#get sp500 prices and convert them to monthly
SP500 <- to.monthly(
  getSymbols("^GSPC", from = "1990-01-01", auto.assign = FALSE)
)
#get 12 month rolling return
SP500.ret <- na.omit(ROC(SP500[,4], type = "discrete", n = 12))
SP500.df <- cbind(
  as.numeric(as.POSIXct(as.Date(index(SP500.ret)))),
  coredata(SP500.ret)
)
colnames(SP500.df) <- c("date","SP500")

#supply the data to our dataless but no longer naked rChart
rChart$set(data = SP500.df)
You might think we are done, but if you call rChart our error is fixed, but we get a new error in the browser because we did not transform our data. This is a common, sometimes easily fixed, sometimes very difficult piece. If we debug the example, we will see the data is provided as an array of arrays.
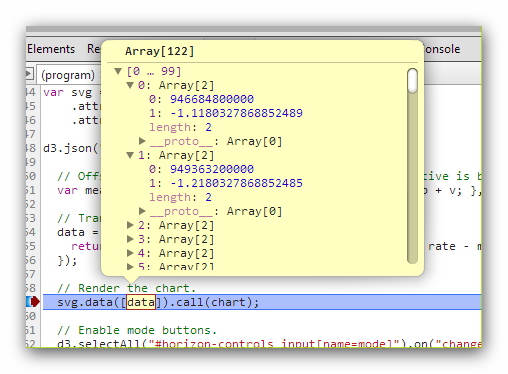
Real quickly, now is a great time to cover how everything is converted from R vectors, lists, data.frames, etc. to javascript. This all happens with the R package RJSONIO. In this case, our params$data is converted to JSON as an array of objects.
We will need to allow an x and y to be specified in R
rChart$set(x = "date", y = "SP500")
and write a simple javascript map transform to do the conversion in our script template
data = [params.data.map(function(d) {return[d[params.x],d[params.y]]})];

svg.data(data).call(chart);
Just one last final item. We need to supply a config.yml for rCharts to know where we have copied d3js and the horizon plugin. It should look something like this.
d3_horizon:
  jshead: [js/d3.v3.js,js/horizon.js]
  cdn:
    jshead:
      - "http://d3js.org/d3.v3.min.js"
      - "http://timelyportfolio.github.io/rCharts_d3_horizon/libraries/widgets/js/d3_horizon/horizon.js"
Our Horizon Chart
Now for the magic moment.
rChart
Thanks
As I hope you can tell, this post was more a function of the efforts of others than of my own.
Thanks specifically:
- Ramnath Vaidyanathan for rCharts and slidify.
- Jason Davies for the Horizon Chart d3 plugin and all his contributions and examples.
- Mike Bostock for everything.
- Google fonts Raleway and Oxygen