Random Collection ... Love d3 but ...
If this seems like a random collection of experiments, it is.
I love my d3 and svg, but sometimes with "big" data it gets a little sluggish. An older battle-tested canvas-based HTML5 library dygraphs claims
Handles huge data sets: dygraphs plots millions of points without getting bogged down.
Before we can test the claim I thought I would try first to plug dygraphs into rCharts much like the rCharts author Ramnath Vaidyanathan explains here and in part 2. Also, why not try out the new R package scholar while we are at it to pay homage to Eugene Fama and his new Nobel Prize.
R package scholar
James Keirstead's new R package scholar offers Google scholar data in a very easy format. As you can see below the code is very simple. One little nuisance I found though is that not all researchers (like Ken French) have Google ids, and even if they do, we have to find them manually.
# Fama from Google Scholar
# http://scholar.google.com/citations?user=yP7euFUAAAAJ&hl=en yP7euFUAAAAJ
# French from Google Scholar does not exist
library(scholar)
famaId = "yP7euFUAAAAJ"
fama.df <- compare_scholar_careers(famaId)
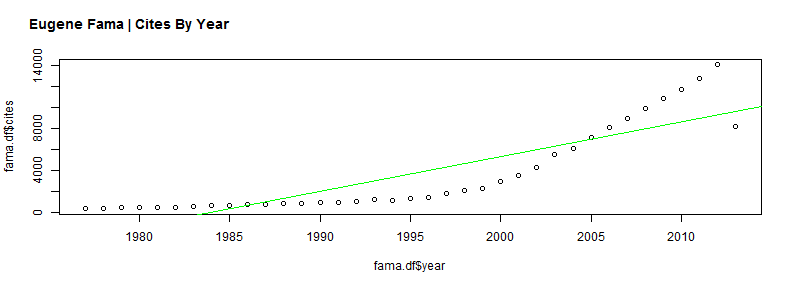
plot(fama.df$cites ~ fama.df$year, type = "p")
abline(lm(fama.df$cites ~ fama.df$year), col = "green")
title(main = "Eugene Fama | Cites By Year", adj = 0.05, outer = TRUE, line = -2)
Plot with rCharts Using dygraphs
Everything is better when it is interactive. Let's expose dygraphs to rCharts for now as a custom implementation.
library(rCharts)

fama.df$date <- paste0("#! new Date(", as.numeric(as.POSIXct(paste0(fama.df$year,
    "-12-31"))) * 1000, ")!#")

dy1 <- rCharts$new()
dy1$setLib(".")
dy1$templates$script = "chart.html"
dy1$set(data = fama.df, x = "date", y = "cites", chart = list(title = "Eugene Fama - Career in Citations from Google Scholar",
    ylabel = "Citations", showRangeSelector = TRUE, labelsDivStyles = list(background = "none"),
    strokeWidth = 1.5))
cat(noquote(dy1$html(chartId = "dygraphCite")))
So far I am very impressed with dygraphs and look forward to more thoroughly testing it especially with larger data sets. Take a look at the gallery to see its full power, mostly out of the box and accessible even with this basic rCharts implementation. Also, there is a very lively Google group of dygraphs-users.
Thanks
- Ramnath Vaidyanathan
- James Keirstead
- Dan, Alistair, Robert, and Klaus - dygraphs contributors
- Marcello Palmitessa