Dygraphs Focus on Retail
Recent price performance by the Retail Industry group seems mighty strong. We already set up the framework for using dygraphs to explore the Kenneth French industry dataset in this post. In honor of Black Friday, let's use it now to focus on US Retail with some help from the R package PerformanceAnalytics.
Notice how the two dygraphs' zoom and pan are synchronized by using the technique shown in this gallery example.
click/drag to zoom; shift+click/drag to pan; double-click to unzoom
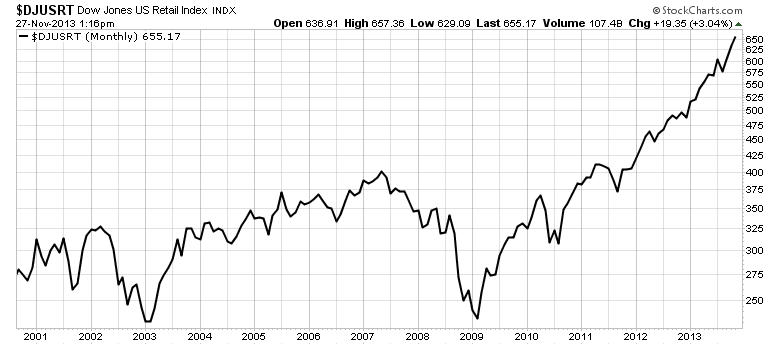
Nothing odd really stands out after this inspection. However, if you look at the Dow Jones US Retail Index, a much different picture appears. I'll save that analysis until after Thanksgiving.
Happy Black Friday!
Get the Data Just Like Before
library(rCharts)
#get very helpful Ken French data
#for this project we will look at Industry Portfolios
#http://mba.tuck.dartmouth.edu/pages/faculty/ken.french/ftp/48_Industry_Portfolios_daily.zip

require(quantmod)
require(PerformanceAnalytics)
#my.url will be the location of the zip file with the data
my.url="http://mba.tuck.dartmouth.edu/pages/faculty/ken.french/ftp/48_Industry_Portfolios_daily.zip"
#this will be the temp file set up for the zip file
my.tempfile<-paste(tempdir(),"\\frenchindustry.zip",sep="")
#my.usefile is the name of the txt file with the data
my.usefile<-paste(tempdir(),"\\48_Industry_Portfolios_daily.txt",sep="")
download.file(my.url, my.tempfile, method="auto",
              quiet = FALSE, mode = "wb",cacheOK = TRUE)
unzip(my.tempfile,exdir=tempdir(),junkpath=TRUE)
#read space delimited text file extracted from zip
french_industry <- read.table(file=my.usefile,
                              header = TRUE, sep = "",
                              as.is = TRUE,
                              skip = 9, nrows=23027)

#get dates ready for xts index
datestoformat <- rownames(french_industry)
datestoformat <- paste(substr(datestoformat,1,4),
                       substr(datestoformat,5,6),substr(datestoformat,7,8),sep="-")

#get xts for analysis
french_industry_xts <- as.xts(french_industry[,1:NCOL(french_industry)],
                              order.by=as.Date(datestoformat))

#divide by 100 to get percent
french_industry_xts <- french_industry_xts/100

#delete missing data which is denoted by -0.9999
french_industry_xts[which(french_industry_xts < -0.99,arr.ind=TRUE)[,1],
                  unique(which(french_industry_xts < -0.99,arr.ind=TRUE)[,2])] <- 0

#get price series or cumulative growth of 1
french_industry_price <- log(cumprod(french_industry_xts+1))
Transform and Supply Data as an Array
Dygraphs allows multiple data format options. We used a CSV url last time. Let's try the Array method.
retail.df <- data.frame(
  paste0("#!new Date(\'",index(french_industry_price),"\')!#"),
  french_industry_price$Rtail
)
colnames(retail.df) <- c("date","price")
sharpe.df <- data.frame(
  paste0("#!new Date(\'",index(french_industry_price),"\')!#"),
  apply.rolling(
    french_industry_xts$Rtail,
    Sharpe,
    width = 36,
    by = 1
  )
)
colnames(sharpe.df) <- c("date","sharpe")
cat(
  '<script>
  var price = ',
  toObj(rjson::toJSON( retail.df )),
  '
  var sharpe = ',
  toObj(rjson::toJSON( sharpe.df )),
  '
  var blockRedraw = false;
  var gs = [];
</script>'
)
rCharts Magic with a Spice of Lodash
dy1 <- rCharts$new()
dy1$setLib( "http://timelyportfolio.github.io/rCharts_dygraph" )
dy1$templates$script = "chart_csv2.html"
dy1$set(
  data = "#!eval('_.unzip(price)')!#",
  chart = list(
    title = "US Retail Since 1926 | source: Kenneth French",
    ylabel = "Cumulative Return (log)",
    labels = "#! _.keys(price) !#",
    labelsDiv = "#!document.getElementById('statusPrice')!#",
    labelsDivStyles= list(
      background = 'none'
    ),
    strokeWidth = 0.75,
    showLabelsOnHighlight = TRUE,
    highlightCircleSize = 2,
    highlightSeriesOpts = list(
      strokeWidth = 1,
      highlightCircleSize = 5
    ),
    width = 550,
    drawCallback = "#!
      function(me, initial) {
        if (blockRedraw || initial) return;
        blockRedraw = true;
        var range = me.xAxisRange();
        var yrange = me.yAxisRange();
        for (var j = 0; j < gs.length; j++) {
          if (gs[j] == me) continue;
          gs[j].updateOptions( {
            dateWindow: range,
            //valueRange: yrange
          } );
        }
        blockRedraw = false;
      }!#"
  )
)
cat(noquote(dy1$html( chartId = "dygraphPrice" )))
dy2 <- rCharts$new()
dy2$setLib( "." )
dy2$templates$script = "chart_csv2.html"
dy2$set(
  data = "#!eval('_.unzip(sharpe)')!#",
  chart = list(
    #title = "US Retail Since 1926 | source: Kenneth French",
    ylabel = "Sharpe ( Rf = 0 )",
    labelsDiv = "#!document.getElementById('statusSharpe')!#",
    labelsDivStyles= list(
      background = 'none'
    ),
    labels = "#! _.keys(sharpe) !#",
    strokeWidth = 0.75,
    showLabelsOnHighlight = TRUE,
    highlightCircleSize = 2,
    highlightSeriesOpts = list(
      strokeWidth = 1,
      highlightCircleSize = 5
    ),
    colors = "#!['gray']!#",
    width = 550,
    drawCallback = "#!
      function(me, initial) {
        if (blockRedraw || initial) return;
        blockRedraw = true;
        var range = me.xAxisRange();
        var yrange = me.yAxisRange();
        for (var j = 0; j < gs.length; j++) {
          if (gs[j] == me) continue;
          gs[j].updateOptions( {
            dateWindow: range,
            //valueRange: yrange
          } );
        }
        blockRedraw = false;
      }!#"
  )
)
cat(noquote(dy2$html( chartId = "dygraphSharpe" )))
Thanks
- Ramnath Vaidyanathan
- Dan, Alistair, Robert, and Klaus - dygraphs contributors
- Kenneth French for the data