
Photo EXIF Analysis | rCharts + catcorrjs + exiftool
Building on my post ISO Popularity on Flickr Explore, I thought I would use R to examine some of my family photos from a recent trip to Disney World. Realizing that EXIF data is categorical, I also wanted to explore a different use for the new catcorrjs with rCharts.
R Can't Do What?
Rarely these days do I find something I cannot do in R. However, it seems the ability to read EXIF meta information from images is a weakness for R. I found adimpro which reveals an ability to read very limited EXIF in its documentation, but I could not get it to work. Even if I had succeeded, the information is too limited. I also looked into plotKML, but its EXIF abilities are limited to read only the EXIF from Wikimedia Commons images. These images have already parsed the EXIF and Wikimedia Commons provides this information through its API.
Using a little R system with the open-source Perl exiftool command-line tool allows us to fill the gap. exiftool is best described by this very helpful CameraTechnica post.
Exiftool was written by Phil Harvey, an amateur photographer who spends his day hours as a nuclear physicist at the Sudbury Neutrino Observatory at Queen’s University. When he saw that his software, originally written to catalog scientific images, was useful for all types of photographs, he elected to freely distribute the open source code to the public. A physicist-photographer-programmer who gives his work away free – this guy has some serious geek cred!
Thanks Phil Harvey for this masterpiece. I highly encourage donating a little to thank Phil for all his work.
Command Line with R
If all else fails, then revert back to the good old command-line days and use R's system function. The CameraTechnica post mentioned above provided a great start to accessing exiftool magic.
#exiftools is really powerful
#http://www.cameratechnica.com/2012/05/23/hack-your-exif-data-from-the-command-line-five-fun-uses-for-exiftool/

#hackiest way to do is just use exiftool through system

#example to see full info on a single photo
#print(system('exiftool -h "../../../../2013-10 Disney/IMG_3555.JPG"', inter=TRUE))


#examine iso across all
#iso.df <- data.frame(
#  system('exiftool -T -r -ISO "../../../../2013-10 Disney"',inter=TRUE),
#  stringsAsFactors = FALSE
#)

#do a combination
info <- system('exiftool -T -r -ISO -ShutterSpeed -CameraTemperature -DateTimeOriginal "../../../../2013-10 Disney"',inter=TRUE)
img.df <- read.delim2(
  textConnection(info),
  stringsAsFactors = FALSE,
  header = FALSE,
  col.names = c("ISO", "ShutterSpeed", "CameraTemp", "Date")
)
#get just date
img.df[,4] <- as.Date(#as.POSIXct(
  paste0(
    gsub(x=substr(img.df[,4],1,10),pattern=":",replacement="-"),
    substr(img.df[,4],11,19)
  )
)
Visualizing Categorical Data (vcd)
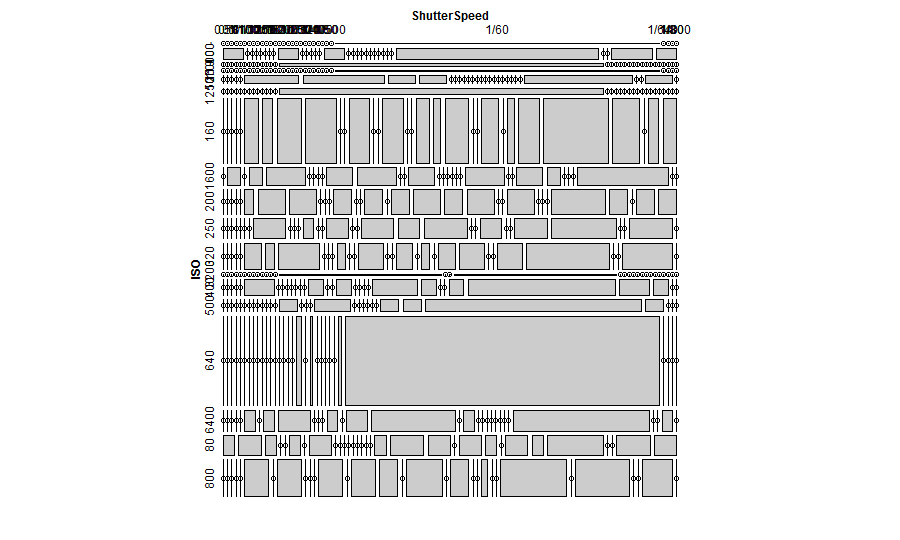
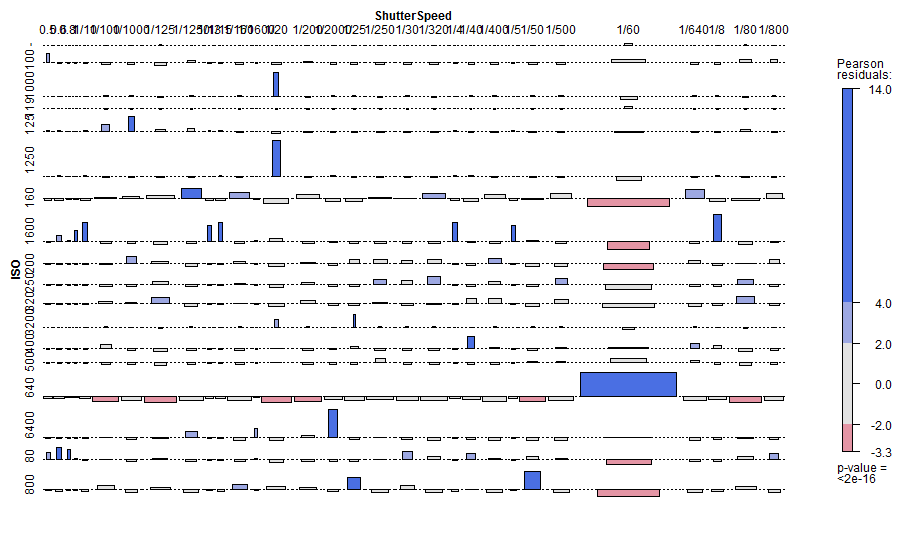
EXIF information is categorical data. R users are fortunate to have the very fine vcdExtra for analysis and visualization of categorical data. Here are a couple of default plots from vcdExtra on ISO speed and shutter speed.
img.df$id = 1:NROW(img.df)
require(vcdExtra)
x11(width = 20, height = 12)
mosaic(structable(img.df[,c(1,2)]))
assoc(img.df[,c(1,2)],shade=T)
#plot(x=img.df$ISO, y=lapply(img.df[,2],FUN=function(x){return(eval(parse(text=x)))}))
catcorrjs - A Mini vcdExtra?
Ever since d3.js I really wanted to see an interactive vcdExtra. catcorrjs in some ways is a nice start in that direction using d3.js and crossfilter. Although catcorrjs seems designed for survey data, applying it to some EXIF metadata shouldn't hurt anything.
require(rCharts)

#remove iso speeds that are not numeric
#manual for now
img.df <- img.df[-(which(is.na(as.numeric(img.df[,1])))),]
img.df$Date <- format(img.df$Date)


catCorrPlot <- function(questions, responses){
  require(rCharts)
  #responses = read.csv(responses_doc)
  responses = toJSONArray(setNames(
    responses[,-1], 1:(NCOL(responses) - 1)
  ), json = F)
  #questions = read.csv(questions_doc, stringsAsFactors = F)
  questions = lapply(1:NROW(questions), function(i){
    qi = as.list(questions[i,])
    qi$choices = strsplit(qi$choices, ";")[[1]]
    qi$number = i
    qi
  })
  questions = toJSONArray(questions, json = F)
  r1 <- rCharts$new()
  r1$setLib('http://timelyportfolio.github.io/howitworks/catcorrjs/catcorrjs')
  r1$set(questions = questions, responses = responses)
  r1
}

responses <- img.df[,c(4,4,1,2)]
questions <- do.call(rbind,lapply(1:2,function(x){
  choices <- unique(img.df[,x])
  choices <- choices[order(unlist(lapply(choices,function(x){
    as.numeric(eval(parse(text=x)))
  })))]
  return(data.frame(
      "outcome",
      colnames(img.df)[x],
      capture.output(cat(choices,sep=";")),
      stringsAsFactors = F
    )
  )
  }
))
colnames(questions) <- c("type","text","choices")
questions <- rbind(questions,c("demographic","Date", capture.output(cat(unique(img.df[,4]),sep=";"))))
questions <- questions[c(3,1,2),]

r1 <- catCorrPlot(questions, responses)
r1$show("inline")
Thanks
- Ramnath Vaidyanathan
- Phil Harvey
- Camera Technica
- Dean Malmgren